AI Platform For Business Analytics
Product: Web ApplicationScope of Work: Front-end, Back-end, Testing, Design, InfrastructureCountry: USAIndustry: Analytics
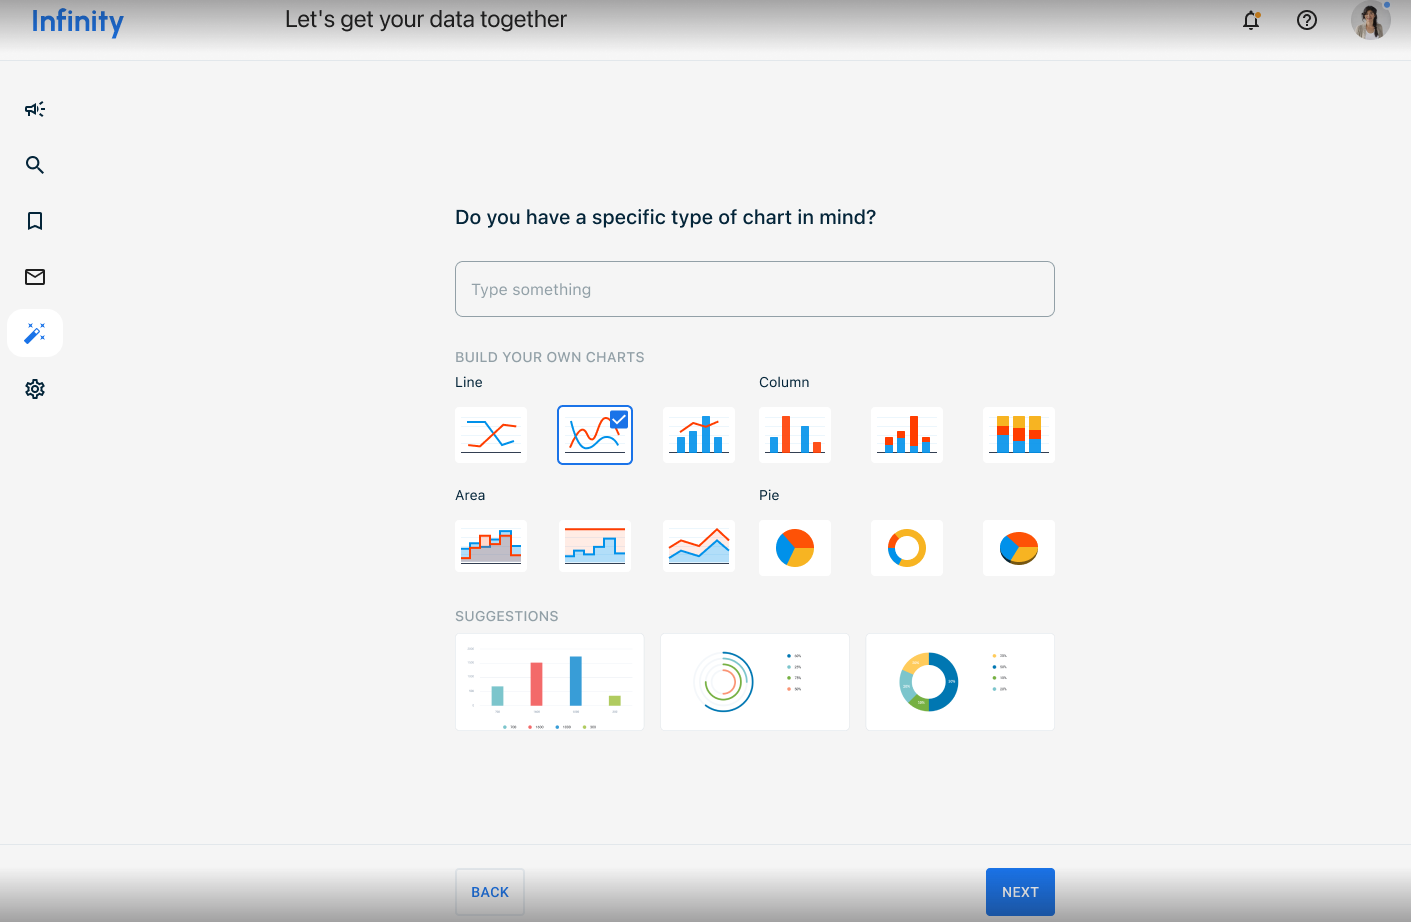
Description
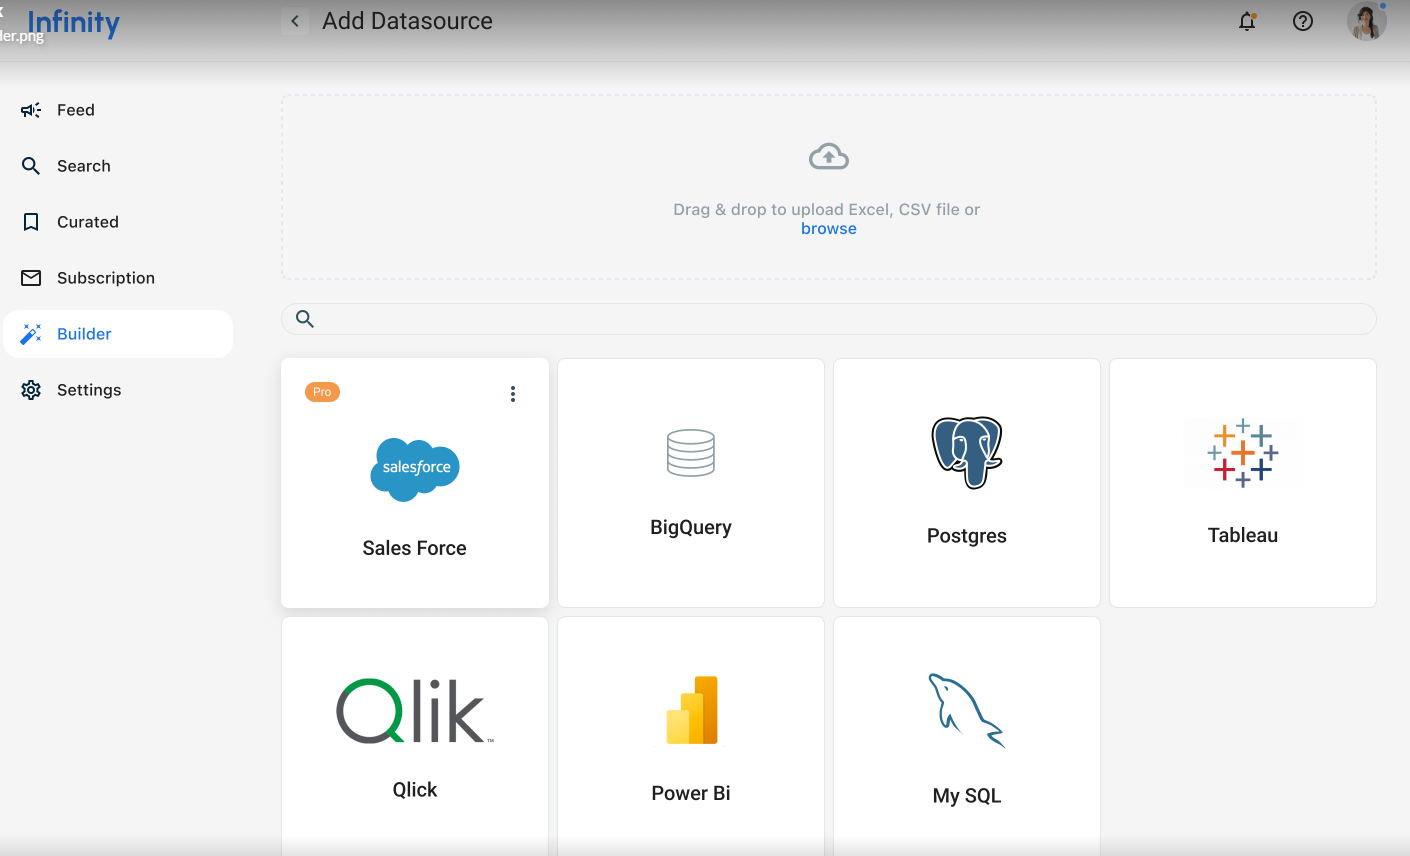
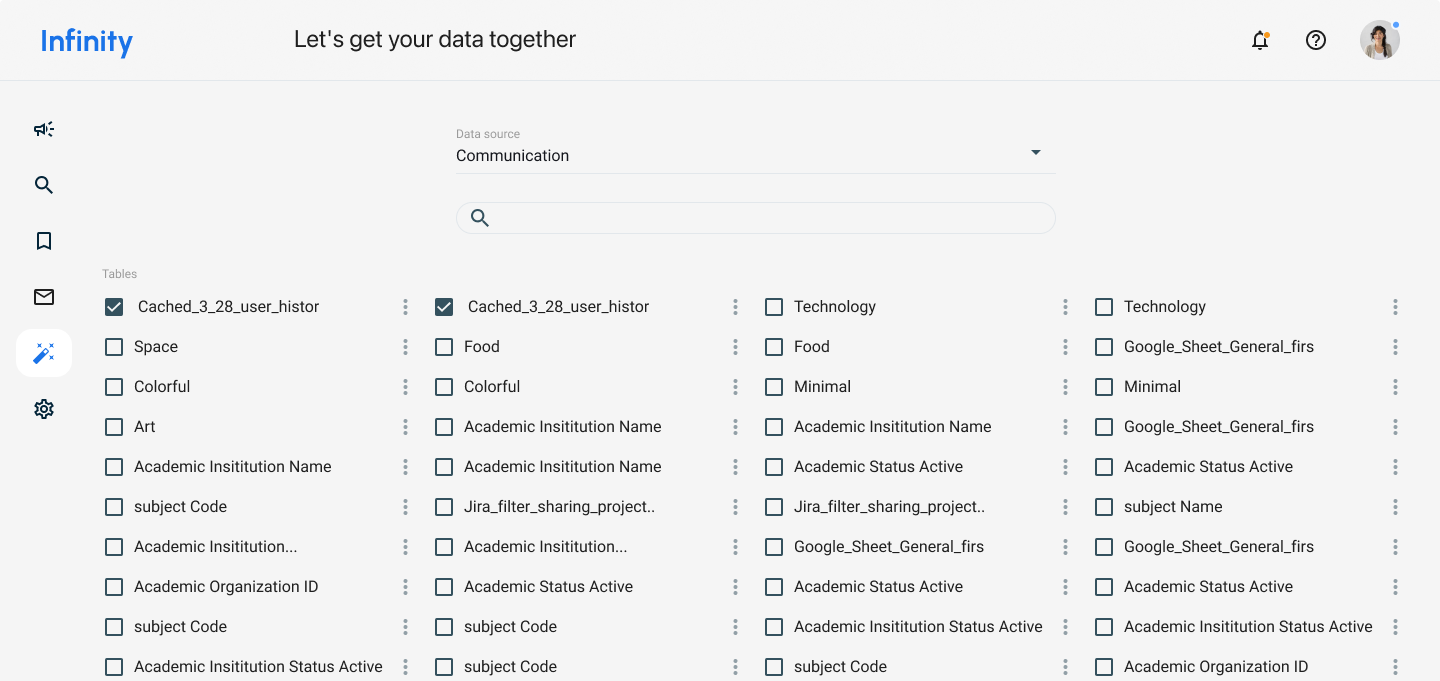
Infinity is a software product of Stotle company designed to provide a platform for corporations, organizations, companies, and B2B enterprises with a wide array of complex data to clean, analyze, transform, manipulate, and visualize data for business intelligence. Also, after implementing AI features the company will concentrate in additional, on the B2C market.
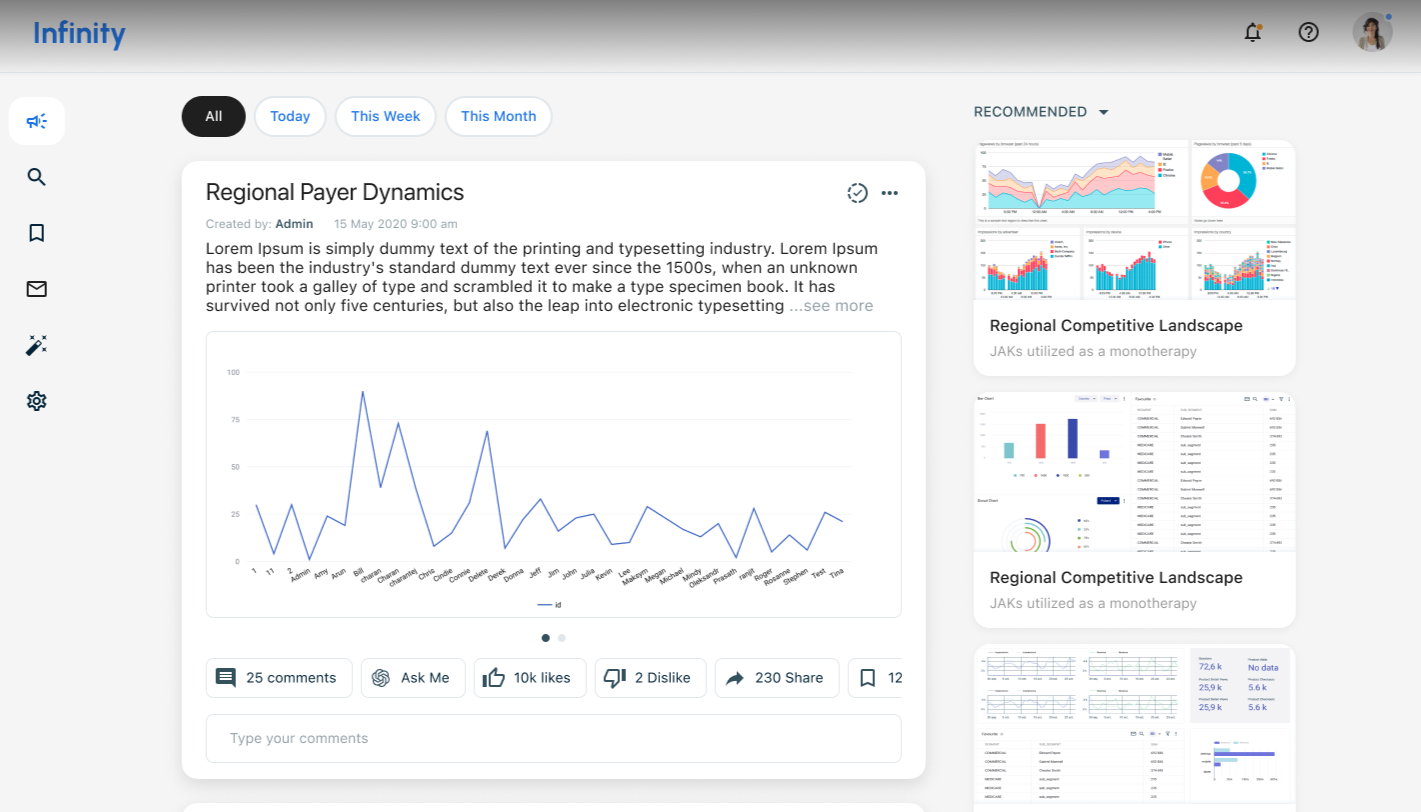
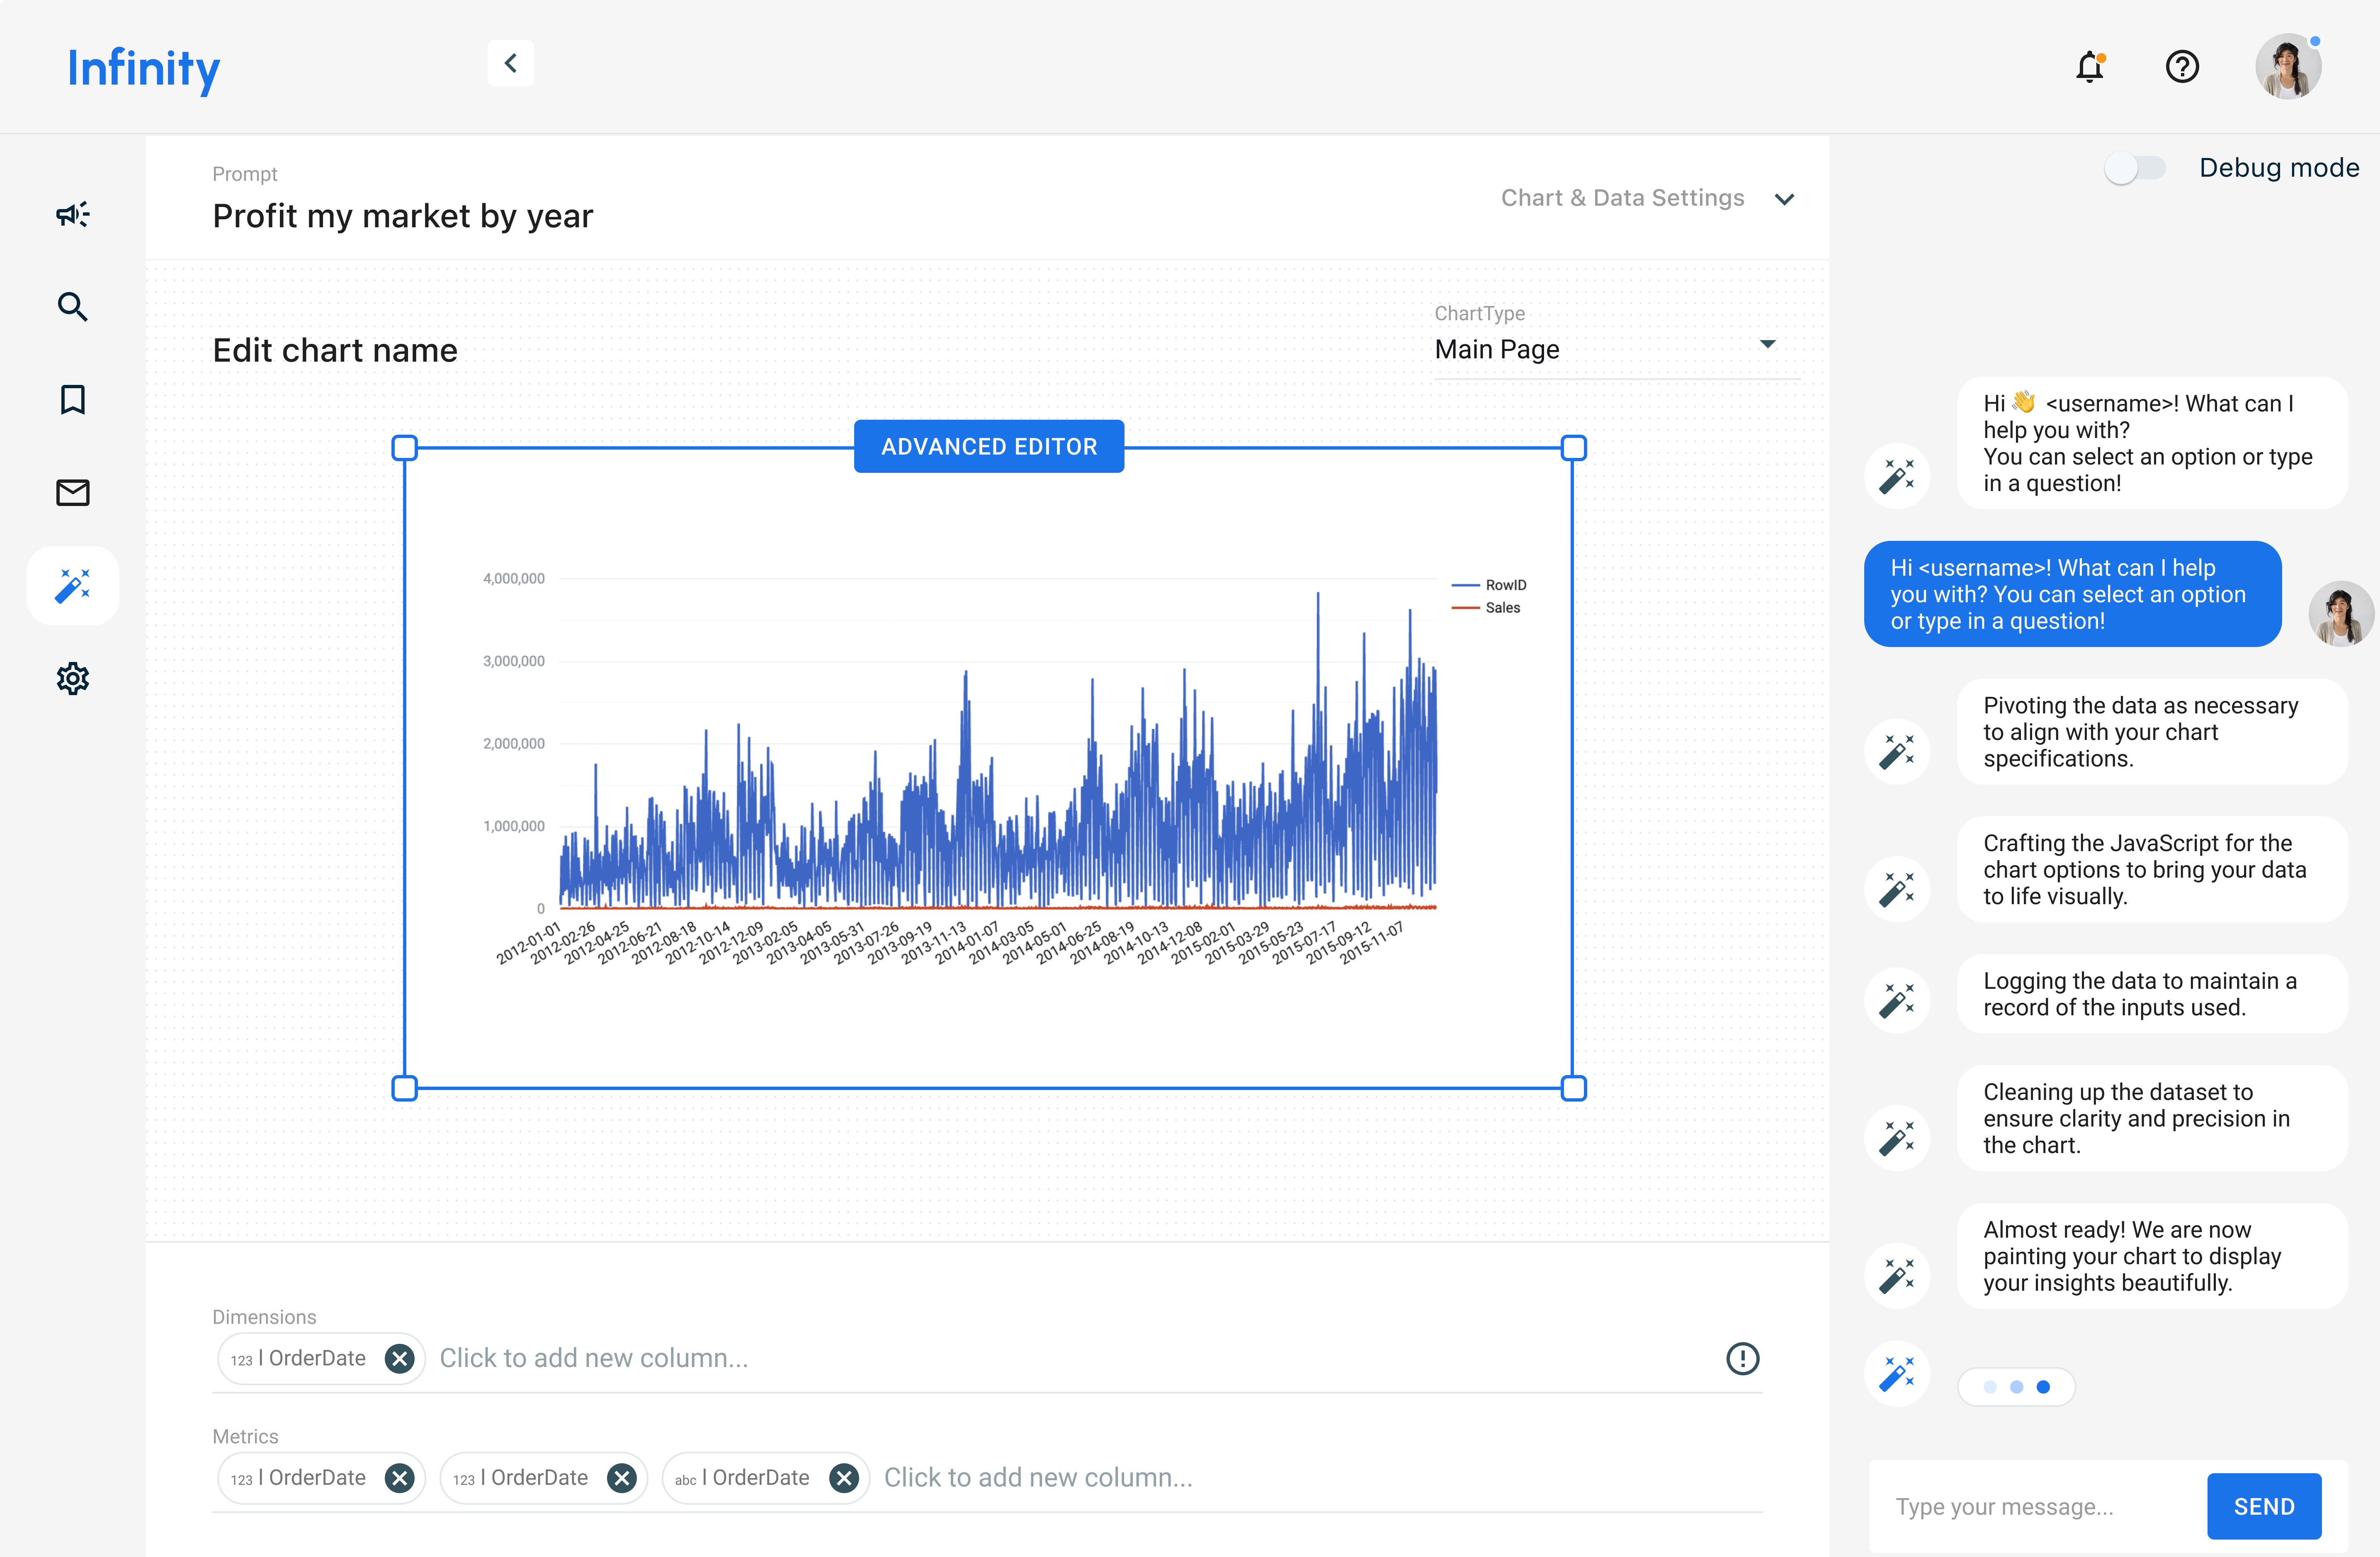
Infinity is an AI platform based in the USA. For years, the firm has been dedicated to advancing business analytics through its revolutionary platform. Infinity’s key features are specifically designed to accelerate time to value through a chat-to-chart interface.
Client Goals
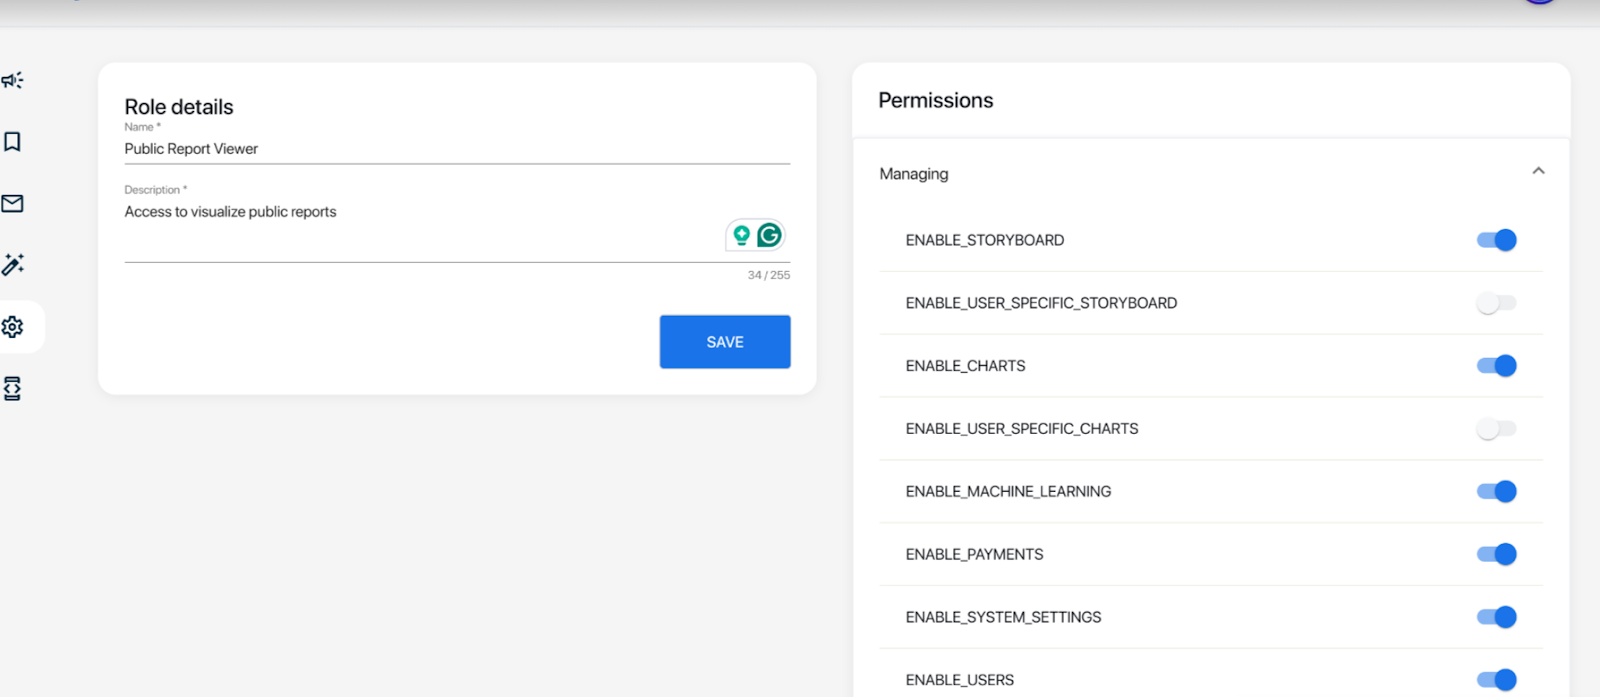
Infinity initially aimed to build an analytical platform from scratch. As the platform grew, the goals expanded to include AI integration for automated analysis, and prediction, and replace the need for BI analysts. The platform also evolved to allow users to create custom charts and personalize the system, leading to a more user-friendly interface. For over eight years, our team has collaborated with Infinity on front-end and back-end development, testing, design, and infrastructure management, all focused on creating a BI tool that visualizes and analyzes data, offering users an intuitive platform for monitoring changes and understanding data semantics.
Our Solution
Before the Introduction of AI
Current AI Implementation and Key Features
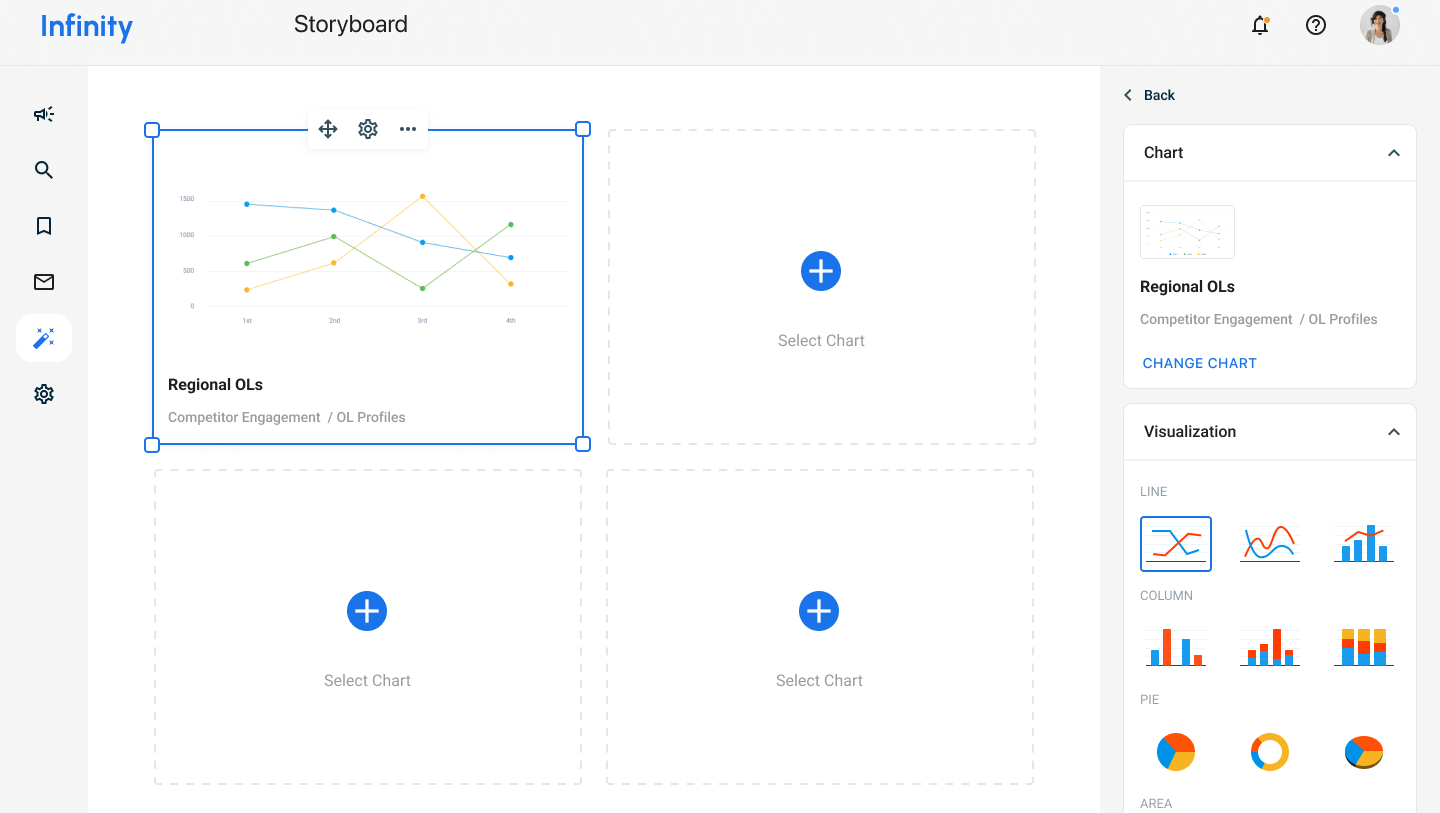
The introduction of AI has remarkably enhanced the Infinity platform, making it more powerful and user-friendly. Creating charts is now much easier, as users can simply select their data source and specify their desired output, with the AI generating the chart automatically. This automation speeds up the process and enables advanced customization options, allowing users to easily modify charts, such as changing colors, chart types, and others in seconds. What truly sets Infinity apart is that no nearest competitors are using AI as a comprehensive solution like this, making our platform uniquely capable of delivering unmatched efficiency and flexibility
Results
The results of our collaboration with Infinity have been remarkable. The platform has seen a significant increase in the number of users (up to 3500) thanks to its enhanced flexibility, convenience, and ease of use. Even before the introduction of AI, the platform greatly simplified BI tools, making them accessible to users with varying levels of expertise. However, thanks to the integration of AI under Inventorsoft’s guidance, the platform has become even more powerful, offering real-time insights, personalized experiences, and a more efficient way to manage and analyze data. Infinity is now positioned as a leader in the business analytics industry, providing users with a cutting-edge tool that adapts to their needs and delivers actionable insights with precision.
Project Details
From our side
Agile
Web
3 Back-end, 4 Front-end, 1 AI Developer, 1 QA, 1 UI/UX Designer
From our side
Postgres, MySQL etc.
2015 - current
Java, Angular